Before the correction, the stock markets in general, and technology and software in particular, had a multi-year run never seen before. The sudden reappearance of inflation and the rise in interest rates to combat it caused a correction in late 2021. There has been a lukewarm rebound recently but few are convinced that the correction is over. Many are nervous that there is more unwelcome news to come.
So how has technology fared during these nervous times? I assembled graphs of Standard & Poors public market indices for various sectors, and a popular graph showing the SaaS public company index. These graphs are discussed below. These graphs inform Table 1 below which summarizes the 1- and 3-year annualized returns for each sector, their highest and lowest values over the last 3 years and value as of Sep 2, 2022, a calculation showing the decline from High to Low during the recent correction, and the recent rally. The sectors are ranked by a Misery Index reflecting the depth of the correction.
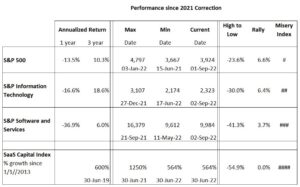
Table 1: Performance of S&P Indices over Various Time Periods
S&P 500:
The S&P broad index returned a decent 10.3% average annual gain over the last 3 years despite suffering a 23.6% decline from its High of 4,797 on Jan 3, 2022, to its Low on June 15, 2022. It has lost 13.5% in the last 12 months. As of Sep 2, 2022, it has rallied to recover 6.6% from its Low.

https://www.spglobal.com/spdji/en/indices/equity/sp-500/#overview
S&P Information Technology:
The Technology sector was more volatile, returning 18.8% over 3 years despite a 30% contraction from its high in the same time period as the S&P 500. It’s one-year decline is 16.6%. A much better 3-year performance if you can stomach the short-term correction.

https://www.spglobal.com/spdji/en/indices/equity/sp-500-information-technology-sector/#overview
S&P Software and Services:
As we narrow the Technology sector to Software and Services, the performance is even more gut-wrenching. This sector suffered a 41.3% decline but over a longer period: 20-months ending in May 2022 compared to the 6-month decline for the S&P 500 and Technology sectors ending in June 2021. The one-year loss is 36.9%, and it has not enjoyed much of a rally; just 3.7%.

Software as a Service (SaaS):
The S&P does not track performance of SaaS as distinct from Software and Services. For that we turn to SaaS Capital which has done extensive research into SaaS performance and valuation multiples. It reports performance based on growth from a starting point of January 2013, rather than an absolute value. In comparing the SaaS graph to the S&P graphs, it is clear that the SaaS index is considerably more volatile than the others. I added the SaaS Index as of June 2019 to Table 1 to show the extreme volatility of SaaS. In the two-year period June 2019 – 2021 the Index more than doubled but gave it all back and more in the in the one-year period ending June 2022.

https://www.saas-capital.com/the-saas-capital-index/
Volatility:
The Misery Index reflects the degree of volatility, especially the High to Low decline. The broad S&P 500 market is the least volatile (although a 23.6% decline is not for the faint of heart). The narrow Technology index is more volatile, while the narrower Software index is more volatile still, and the SaaS Index defies rationale explanation.
What does this mean for the technology sector? First, the tech sector is volatile: the highs are higher and the lows are lower. The current correction is one of many to hit the sector (like 2000 and 2008). There is nothing unusual in this.
Corrections of this magnitude take a long time to recover from. The sector that suffers worst in a correction is not the one that leads the markets out of it. A rapid run-up in stock prices in the technology sector as we saw in the late 1990s and 2020-2021 will not restart any time soon. We are likely to see the same slow recovery as we did after the major correction in 2000 where it took the NASDAQ 15 years to return to its previous high.
The Bigger Picture:
There are broad trends in the macroeconomic picture which may override the technology sector. For several years central banks have been flooding the economy with liquidity initially to save the financial system from meltdown in 2008 and subsequently to keep the economy going during the pandemic. Both programs were essential at the time, but the banks continued to print money to stimulate economic growth. The excess liquidity was a major cause of the run-up in stock markets and ignited the current round of inflation. The banks are now raising interest rates to reduce inflation to the benchmark range of 2 – 3%. This will be a lot harder to achieve than ever before because of the unprecedented amount of debt. It may take years of higher interest rates to tame the beast. During this time, financial markets will cool. Financings and exits will be harder to achieve.
But that does not mean that financing or exits for technology companies are over. A quick scan of Crunchbase indicates that private technology companies are still receiving angel and venture capital financing. As reported widely, there are billions of dollars of “dry powder”, or money in venture capital and private equity funds, which needs to be invested. However, investors will now take their time and do their diligence in the time-honoured way. The herd mentality which characterized the recent run up in stock prices has already vanished. Good deals will get financed, but it will take longer. If the SaaS Index is any indication, valuations have already begun to decline.