There is a long-held belief that the financial markets for technology companies are highly volatile (as seen in the tech bubbles of 1999 and 2021 followed by the crashes of 2000 and 2022), whereas the healthcare financial markets are more stable.
Strategic Exits Partners compared financial data from both sectors for Funding, Valuation and M&A. The results were surprising. The sectors follow the same patterns in some respects but not in others.
We compared Funding and Valuation data as follows:
- Private company funding compiled by CB Insights and PitchBook.
- Private valuations from CB Insights, PitchBook and published stock market indices.
- M&A deal counts from pwc and PitchBook.
Most of the data is in graphical format.
- Funding Volume
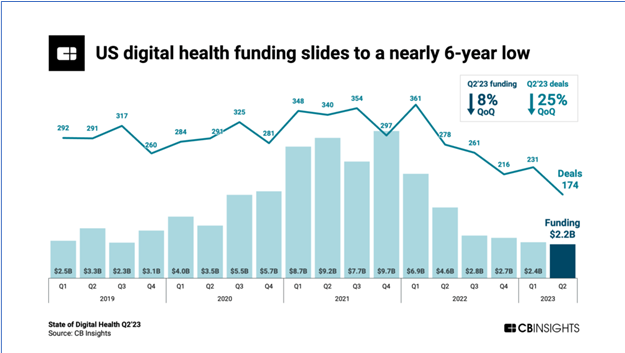
This chart shows private funding for Digital Health:
Link: https://research-assets.cbinsights.com/2023/07/24155551/State-of-Digital-Health-Q223-US-Funding.png
The dollar volume of private funding for Digital Healthcare companies rocketed in 2021, crashed in 2022 and has remained stable for the last 3 quarters at levels which are lower than before 2019.
Source: CB Insights: State of Digital Health Q2’23 https://app.cbinsights.com/research/report/venture-trends-q2-2023
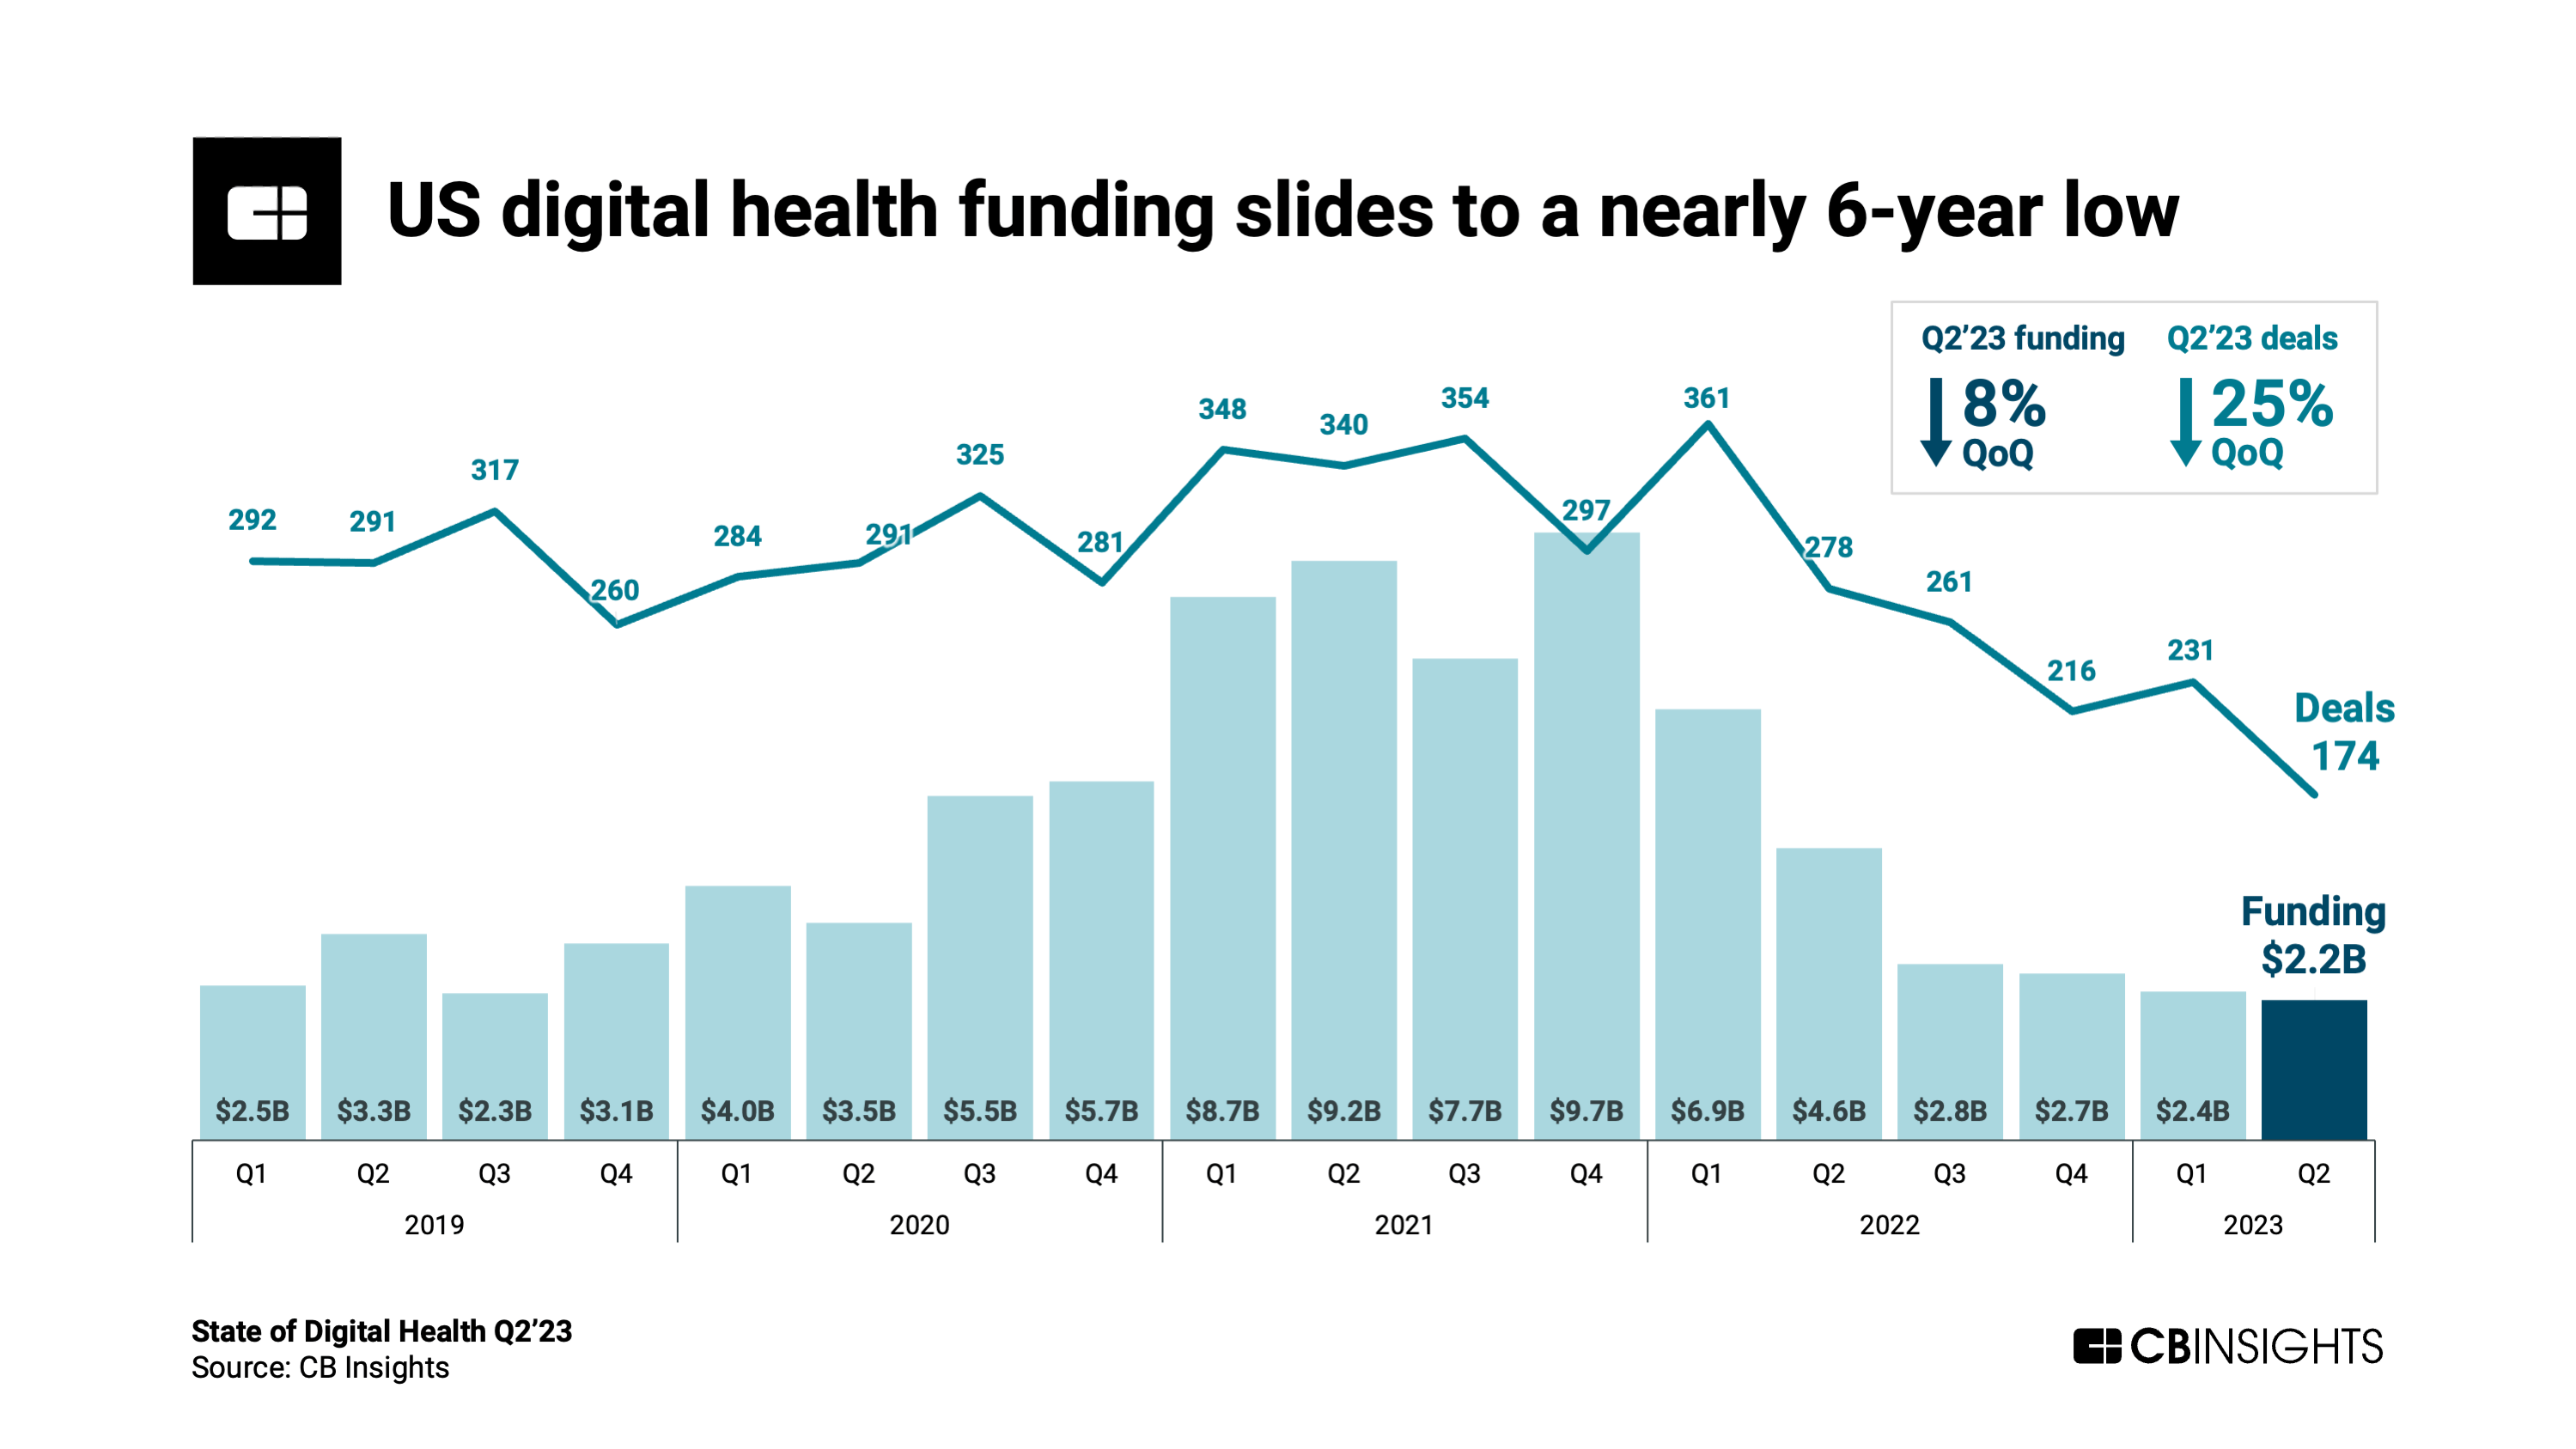
Private investment in private US All Venture companies experienced a similar spike in 2021, a retrenchment in 2022, but bumpy performance for the last 3 quarters, again at levels lower than 2019.
If the healthcare financial markets were more stable, we would expect the changes from quarter to quarter to be significantly greater for all venture than for digital health. Sentiments change quickly in the venture sector, and movements can be volatile, as shown in the “US funding loses steam” graph. By contrast, we would expect Digital Health funding to be relatively steady, as healthcare investors look to stable and growing markets for their investee companies.
Surprisingly, the private funding patterns between venture tech and Digital Health since track each other fairly closely. Both sectors experienced the bubble of 2021 and the crash of 2022.
Strategic Exits Partners prepared the graphs above from data included in CB Insights: State of Digital Health published in their newsletter July 26, 2023 and State of Venture Q2’23 Report published in their newsletter July 13, 2023.
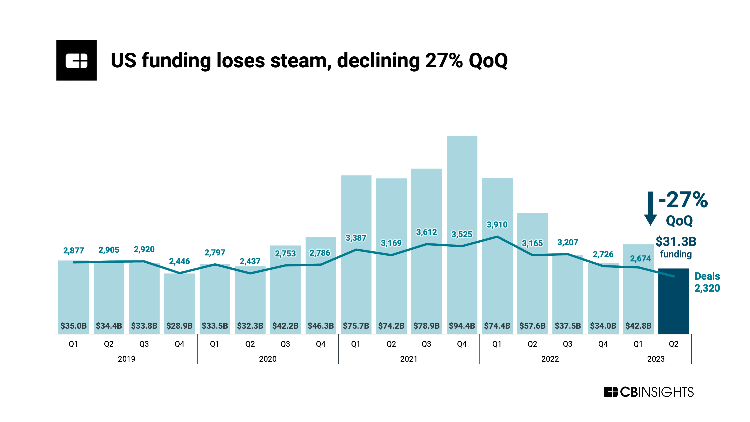
Venture is right hand axis; Digital Health is left-hand axis. This graph shows that, proportionately, funding to Digital Health and All Venture is about the same.
- Valuation / Public Markets
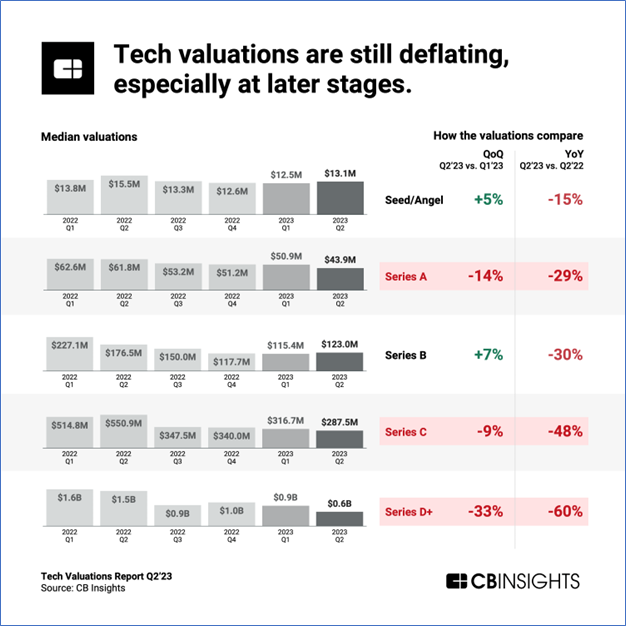
Now let’s look at the valuation trends for All Venture and Digital Health. The Q2’23 Tech Valuation Report data from CB Insights for different sizes of venture companies is shown in the chart below. We looked at the Seed and Series A tranches which are more relevant to our practice in early-stage tech companies.
Link: www.cbinsights.com
The graph above indicates that valuations of all venture companies have been volatile over the last 6 quarters to Q2’2023, as we would expect. Significantly, the valuations for Seed/Angel and Series A (the sectors that most interest us) are off 15% and 29% comparing Q2 of 2022 and 2023. (A comparison to the bubble year of 2021 would be helpful.) However, note that this graph shows private company data.
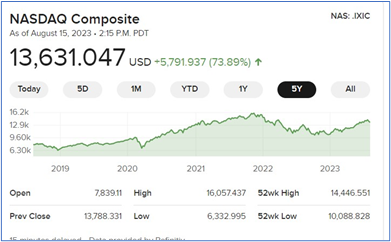
Public company data is much different. The public NASDAQ index soared in 2020-2021, crashed in 2022 and is rising steadily through H1 2023. This is in direct contrast to the private tech company performance.
Now let’s compare valuation trends between All Venture and Digital Health. There are many Exchange Traded Funds (ETFs) tracking subsets of the large public healthcare sector. The graph below shows the recent performance for the Global Health Care Technology and Innovation ETF.
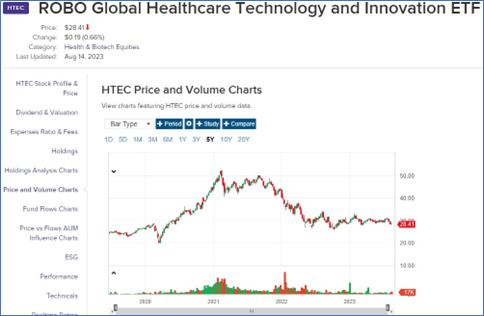
The graph above shows that the public companies tracked by the Global Healthcare Technology and Innovation ETF experienced the bubble in 2021, then declined about 40%, then has been flat for 3 quarters.
So, different performance again since the crash. Whereas public tech has been rising, private tech has been falling, and Digital Health has been flat.
This begs the questions:
- why are the performance of public tech private tech and digital health companies diametrically opposed?
- Why is healthcare so volatile, contrary to industry opinion?
- Mergers and Acquisitions
The last item to compare is M&A activity in Digital Health and All Venture. The graphs below show the numbers of M&A deals completed in each sector.
First, the PitchBook graph of North American M&A:

Source: PitchBook Data, Inc.
From this graph we accessed the number of M&A deals for 2019 to 2022.
Next, we sourced a graph prepared by pwc indicating the annual deal M&A volume for the health industry in the Americas.
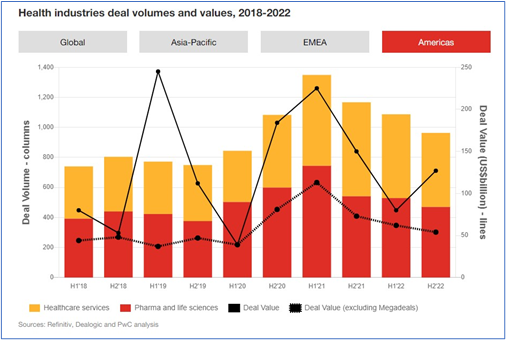
Link: https://www.pwc.com/gx/en/services/deals/trends/2023/health-industries.html
We extracted the data from the gold Healthcare services bars in the graph to generate the annual deal volume for 2018 – 2022.
The annual data points allow a direct comparison between M&A for Venture as accessed from PitchBook, and Health Services as derived from the pwc graph. The comparison is shown in the Excel graph below which Strategic Exits Partners prepared:
Although there are only 3 annual data points to compare, it appears that the curves track each other fairly closely. This suggests that the M&A activity for All Venture and Digital Health through the peak of 2021 and the collapse in 2022 were approximately equivalent.
Regrettably the 2023 data for M&A is not yet available. We cannot see whether the Digital Health M&A market is:
- continuing to decline as is private investment as shown in the PitchBook graph above,
- recovering as shown in the NASDAQ graph, or
- in steady state mode as shown in the ROBO ETF graph.
- Where do Digital Health and Venture follow each other?
Summarizing the 3 sets of data in tabular format:
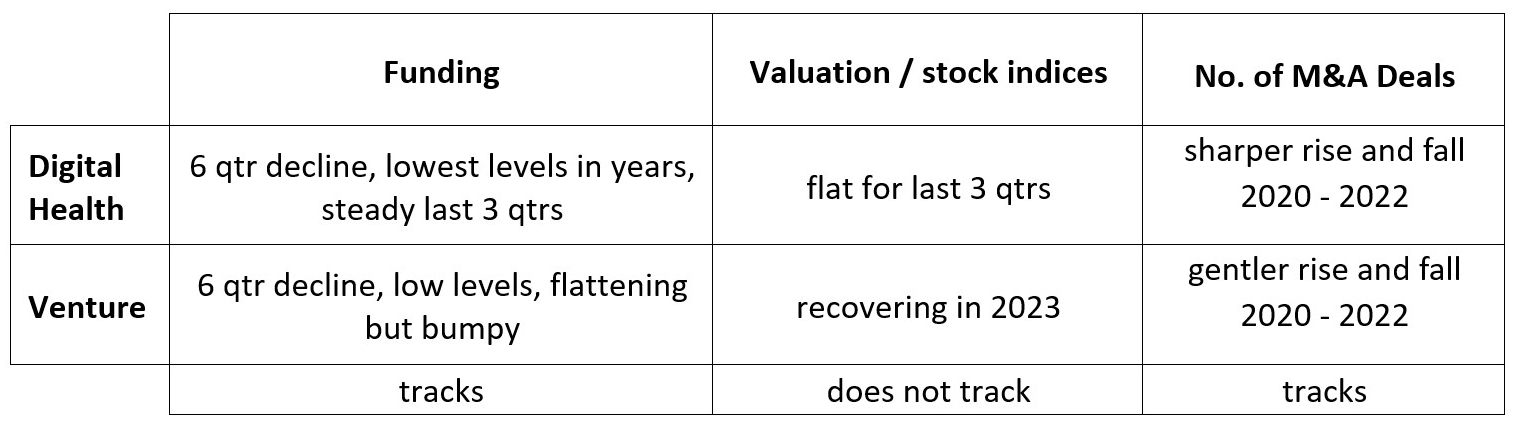
In summary, through the bubble of 2021, the collapse of 2022 and the recent performance in the first half of 2023:
- There is no significant difference in the pattern of funding for Digital Health and All Venture.
- There is no pattern to public company trends in valuation.
- Investment and M&A in Digital HealthCare track each other, at least until 2022, which suggests that Healthcare M&A is as volatile as venture.
Why?
Could it be that private funding is driven by Private Equity and Venture Capital firms who take a sophisticated approach to investing and valuation, but paradoxically, also tend to follow the herd? If PE and VC use the same approach for both Digital Health and All Venture funding, then we should expect the investment patterns to track each other, which they do. This runs contrary to the age-old belief that healthcare is less subject to swings in the financial markets. This may be an important consideration for investors who are looking for more stable investments than the volatile All Venture sector. The data shows that it may be risky to turn to healthcare sector for stability.
Note that PE and VC have nearly $2 trillion[i] in dry powder which they are not investing until confidence returns to the markets. Investment in Digital Health is lower than in 2019. Typically, the stabilization in the tech industry takes a few quarters before valuations start to show steady increases, so we might see a rebound in venture funding to start in Q4 2023 at the earliest, or early 2024. When the rebound starts, it should be vigorous: significant dry capital, current low rates of investment activity, and the herd instinct should quickly trigger a burst of new private investment.
Since Digital Health tracks All Venture tech in private investment, a rebound in venture should generate a rebound in Digital Health.
[i] https://www.spglobal.com/marketintelligence/en/news-insights/latest-news-headlines/global-private-equity-dry-powder-approaches-2-trillion-73570292