Note: there is a 16 minute video at the bottom of this post which summarizes the main points.
UPDATE
Previous versions of this article described a valuation process for SaaS companies that relied on the Annual Recurring Revenue (ARR) times a Revenue Multiple adjusted for the characteristics of the specific SaaS company. This current update in January 2024 improves on previous versions in two ways: first, it eschews the Revenue Multiple concept in favour of a Valuation Multiple which includes more factors. Secondly, it reduces double-counting of key adjustments, for example, growth and churn, which are already accounted for in the baseline valuation model.
This updated version uses data and methodology gathered and developed by SaaS Capital Inc.
CALCULATING A SAAS COMPANY VALUATION
The revised formula for estimating the valuation of a SaaS company is:
SaaS company valuation = Annual Recurring Revenue * Adjusted Valuation Multiple.
This resembles the often-used ARR times Revenue Multiple. The Valuation Multiple encompasses more SaaS valuation variables than the Revenue Multiple does.
STEP 1: BASELINE VALUATION MULTIPLE
Detailed research of several hundred articles on SaaS valuation indicated that most valuation models are based on the Revenue Multiple. SaaS Capital, a prominent venture debt lender, has done deep research over the years on SaaS valuations. They have developed a similar formula, but using a Valuation Multiple instead of a Revenue Multiple.
In their seminal white paper: WHAT’S YOUR SAAS COMPANY WORTH? they develop a formula to calculate a Baseline Valuation Multiple based on:
- SaaS Capital Index (SCI)
- ARR growth rate
- Net Revenue Retention (NRR)
SCI captures all of the external factors on valuations experienced in the public markets. ARR growth rate and NRR capture the factors internal to the company.
Let’s explain each of the terms and then introduce the formula.
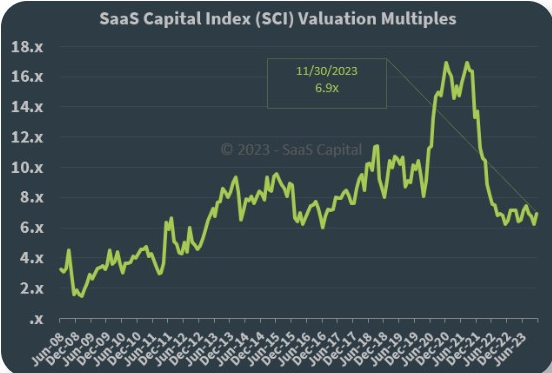
- SaaS Capital Index (SCI) is an average revenue multiple for 91 public SaaS companies that is calculated and updated by SaaS Capital monthly. See the graph below of the SaaS Capital Index.
Until 2022, using SCI to calculate private company valuations was dubious because of the volatility of the SCI. The graph below tracks the SCI from 2008 to 2023. In 2008, public SaaS company valuations were volatile and steadily rising, from 2 – 4x ARR in 2008 to 16x in 2021, before collapsing to 6 – 7x in 2022 -2023. Currently, in Q1 2024, the public SaaS multiples have been holding steady for several quarters at around 6 – 7x Annual Recurring Revenue.
With the reduced volatility currently, one can have more confidence in valuation calculations using the SCI Capital Index.
Source: SaaS Capital
- ARR Growth Rate is the change in ARR from the most recently completed quarter to the same quarter a year ago. This method captures the stability of annual growth but heavily weights recent growth which is the focus of valuation in SaaS companies.
ARR growth rate is the single most important factor in calculating a SaaS company valuation. It is the key variable that all investors and acquirers focus on among the many variables that affect valuation. Because the SaaS business model requires customers to pay up front, and typically the SaaS software is mission-critical for the customer, a rapid growth rate points to earlier, larger and more predictable profits in the near future.
- Net Revenue Retention (NRR) is the total revenue retained from existing customers only. It is calculated as follows:
from existing customers only at the beginning of the year:
Recurring Revenue at the end of the year / Recurring Revenue at the beginning of the year
expressed as a percentage.
Upsells, cross-sells and upgrades are not included because they are sales of a different product than the SaaS subscriptions. Increased sales of SaaS subscriptions to existing customers are included.
This method is a more refined calculation of churn, as it allows an NRR greater than 100%. In practice, a positive NRR indicates that additional sales to existing customers are out-pacing any lost revenue. Conversely, if the company is losing sales, the churn of existing customers cannot be hidden by the addition of revenue new customers.
It may be difficult to calculate NRR for some companies. In such a case, set the NRR to zero.
Baseline Valuation Multiple Formula
SaaS Capital performed a deep statistical analysis to develop a formula using ARR, NRR and SCI to calculate the Baseline Valuation Multiple:
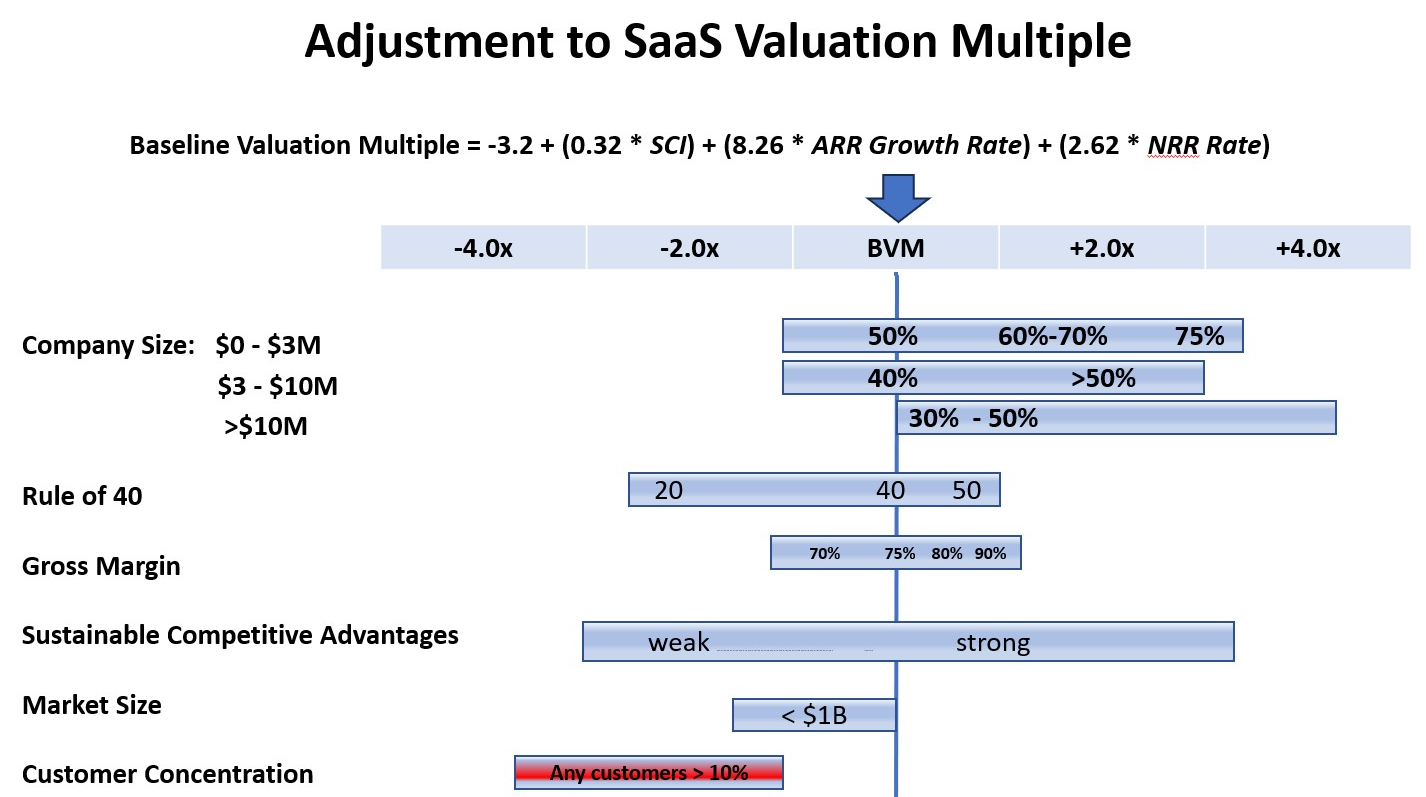
Baseline Valuation Multiple = -3.2 + (0.32 * SCI) + (8.26 * ARR Growth Rate) + (2.62 * NRR Rate)
SaaS Capital generated the table below showing the Baseline Valuation Multiples for ARR growth rate between 10% and 150% and NRR between 85% and 115%, all with an SCI of 9.1:
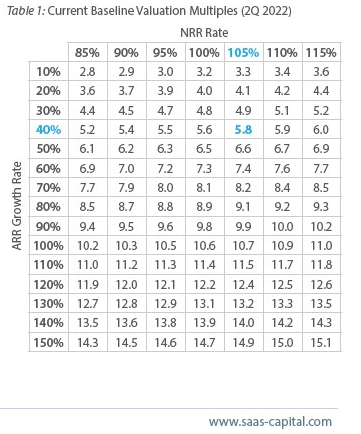
(see note below [i] ).
You will need to generate a version of the table for each value of SCI. It may be easier to use the formula instead.
The Baseline Valuation Multiple calculated using either the formula or the table above can then be adjusted for the specific parameters of the SaaS company. The adjustment is as much art as it is science.
STEP 2: ADJUST THE PRIVATE SAAS VALUATION MULTIPLE
There are many factors which inform the SaaS company valuation, including:
The Valuation Multiple captures all of the factors that influence the valuation either up or down for that company. There are dozens of factors and some overlap. Here is a partial list:
- Annual growth rate of ARR
- Net Retention Rate (NRR)
- Rule of 40
- Public Market Valuations (using SCI as a proxy)
- Customer Long Term Value (LTV)
- Customer Churn
- Customer Acquisition Cost (CAC)
- Company size
- Gross Margins
- Scalability (adding revenue faster vs. growing the cost to service)
- Total Available Market (TAM)
- Founder involvement
- Customer Concentration
- Competitive Advantage
- Value proposition
- Marketing channels
- Management Strength
- Market growth
- … and others
The sum total of these adjustments typically results in an overall adjustment to the Baseline Valuation Multiple within a range of + / – 30%.
Many of the factors in the long list above are incorporated into the Baseline Formula, and don’t need to be considered in adjusting the valuation:
- ARR Growth rate is included in the Baseline Valuation formula
- NRR is included in the Baseline Valuation formula
- Churn, the percentage of recurring revenue lost each year is captured in NRR rate
- Long Term Value, the revenue generated by a customer is calculated using the churn rate
- Customer Acquisition Cost (CAC) affects company expenses, which is captured by the Rule of 40 explained below
We will examine several of the other factors in the list for their impact on the valuation multiple. For each factor, we will estimate a range of a potential adjustments to the Baseline Valuation Multiple between -4x and +4x and show the range of the potential adjustments in a blue-coloured ruler.
Let’s start with Company Size:
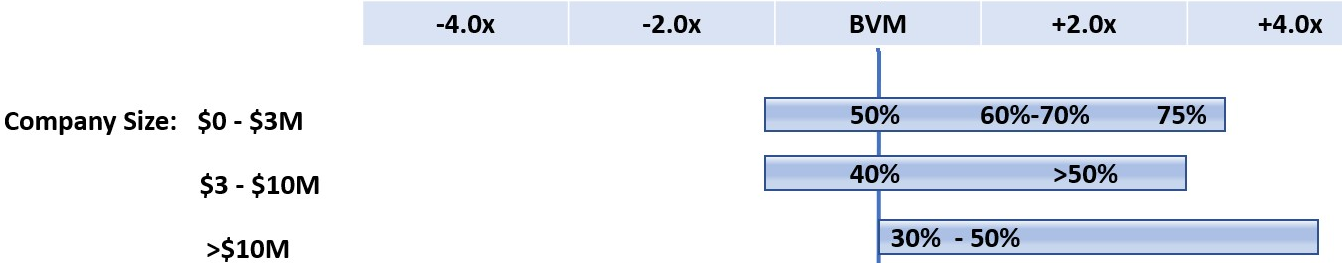
All else being equal, larger companies earn a higher valuation than smaller companies experiencing the same growth rate. Larger companies are better established with a larger roster of clients so the risk of lower revenues is less and their valuation is therefore higher.
The graphic above includes data generated by SaaS Capital in 2019: “What’s Your SaaS Company Worth”. The first row indicates that for SaaS companies generating $0 – $3M in recurring revenues, the average annual growth in ARR is 50% which marks the Baseline Valuation Multiple. If the company is growing at 60% – 70%, the BVM can be increased by 1x – 2x. At 75% growth, the BVM can be increase by 3x or more.
For larger companies generating $3 – $10M in ARR, the average annual growth in ARR is 40%. As the growth rate increases, so does the valuation. At 50% growth, the BVM can be increased by 2x (which demonstrates that these larger companies have a larger multiple at the same 50% growth rate as companies generating $0 – $3M in ARR.)
For companies in both ranges: $0 – $3M and $3 – $10M, if the company is not growing at least at the average rate, it will suffer a reduction in valuation multiple.
Finally, companies generating more than $10M in ARR can see significant increases in multiple if their growth rate exceeds 30% – 50%. Again, there is a valuation premium for high growth in larger companies, but no penalty if the growth rate is below the average.
Rule of 40:
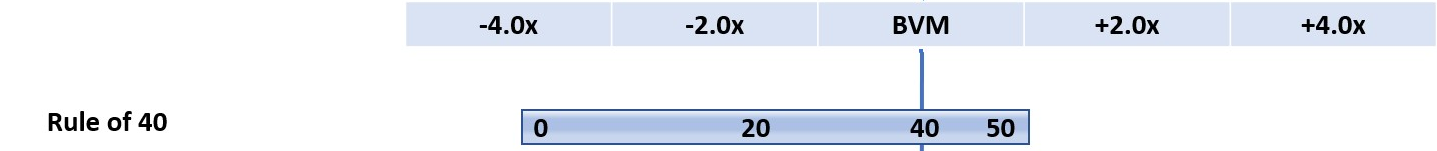
The Rule of 40 balances the trade-off between growth and profitability. For an investor or acquirer to have confidence in the company’s performance, the sum of ARR growth and EBITDA margin should be at least 40:
ARR growth rate + EBITDA margin > 40
Early-stage SaaS companies are focusing primarily on growth, not profitability, so the Rule of 40 is adjusted for companies with less than $10M in ARR:
1.33*ARR growth rate + 0.67*EBITDA margin > 40.
If the calculation results in a value greater than 40 the adjustment to the Valuation Multiple is positive, and vice versa.
Foundry Group reported 92 companies’ performance against the Rule of 40 which informed their revenue multiples as follows:
Performance TTM Revenue multiple
>40 6.4x
20 – 40 5.3x
0 – 20 3.8x
<0 1.9x
Adjusting to anchor 6.4x as the midpoint, these numbers translate to the range in the ruler above.
Gross Margin:
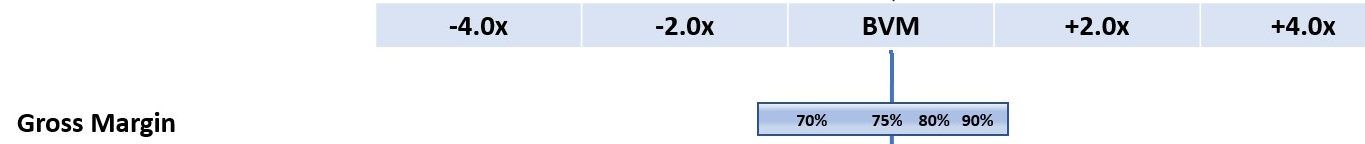
Typical gross margins for software companies are about 75%. As depicted in the graphic, SaaS companies exceeding 80% in gross margin earn a small premium while those generating less than 75% are penalized. The net margin captured by Rule of 40 does not double-count the Gross Margin because it reflects expenses below the gross margin line.
Sustainable Competitive Advantages:
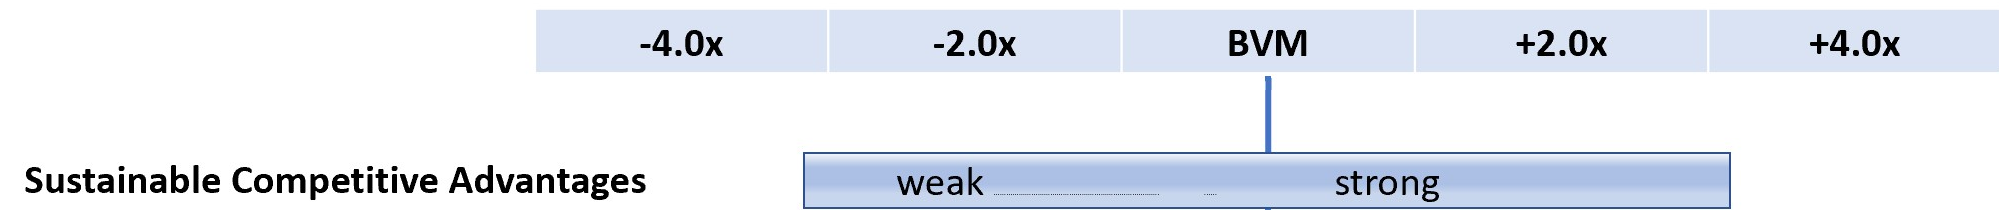
Sustainable competitive advantages refer to how well companies can defend their position. Tech companies build virtual moats to defend their revenue and profit streams from competition. Well-protected companies are rewarded with higher valuations. Some examples of moats:
- Customer sales cycles and inertia: large utilities and governments have long sales cycles. It is difficult to land the sale, but once you have, the customers are unlikely to undertake the sales process again for a competitor. Revenues from these sales are highly predictable and protectable.
- Intellectual Property protection: It is becoming more common for software companies to seek patent protection on their innovations. Companies that can protect their key algorithms have higher prices, more predictable revenues and higher revenue multiples.
- Complex code: Companies that have invested heavily in developing a complex code base have a development lead time advantage over their competitors, leading to a higher SaaS valuation. Indeed, many software companies are sold in their early stages primarily because their unique code gives them a time to market advantage that acquirers are willing to pay for.
- Founder Involvement: If the founder stays with the company after the transaction, then his/her knowledge of the market segment, technology and team are available to the acquirer. Integration is easier and the acquired company generates value more quickly.
- Technical and industry knowledge: A software company with an established reputation and deep contacts in its industry has a strong competitive advantage because as long as they continue to perform, their customers have no reason to switch to a competitor.
- Management Strength: an experienced management team is able to sustain the SaaS company’s growth avoiding the execution errors which doom so many early-stage tech companies.
- Customer acquisition channels: If the customer acquisition channels are established and generating revenue, then your company has an advantage over earlier stage companies which increases the multiple.
- Scalability: If your company can grow quickly without significant investment in additional resources, it is highly attractive and commands a premium on the multiple. Fully-remote companies have a distinct advantage as described in the companion article: Why Fully Remote Companies Sell for More Money.
Conversely, if the company is in well-served markets with easily reproduced products, their moats are weak and the company it is worth much less. We have assigned a range of adjustments from +3x to -3x.
Market Size:
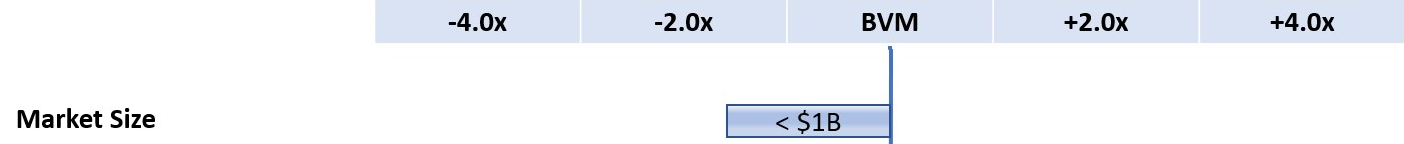
Companies targeting a large market opportunity won’t reach market saturation for years. Generally, an addressable market exceeding $1 billion is sufficient. Companies addressing smaller markets have less of an opportunity for a big exit, which is reflected in a reduction in their valuation.
Customer Concentration:
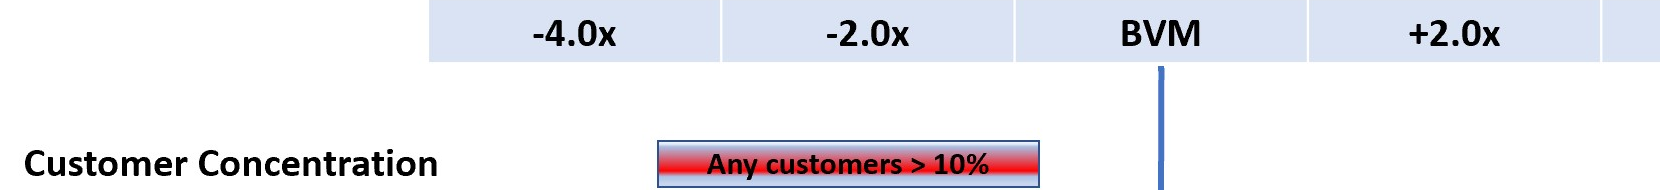
Many private equity acquirers will not entertain an acquisition of a company if any one customer represents 10% or more of the revenue because the loss of that customer would materially affect the business. The decision is almost binary: either the acquirer accepts the risk and continues to analyze the company, or it withdraws. The red highlight in the ruler indicates that the adjustment is binary.
SaaS Key Performance Indicators:
No discussion on SaaS valuation is complete unless it convers the traditional key performance indicators for SaaS companies:
- LTV / CAC: Long Term Value (LTV) is the average expected revenue of a customer over its lifetime:
LTV = MAR * GM% / Churn:
MAR is the Monthly Average Revenue per customer. GM% is the average gross margin in %. Churn is the number of terminating customers per month divided by the average number of customers during the month. You can also look at the quantum of revenue instead of the number of customers to calculate churn. - CAC: The average Customer Acquisition Cost includes all sales and marketing costs: salaries, commissions, and program expenditures. Sum these costs over a quarter and divide by the number of customers acquired during that quarter.
- Churn rate: An annual churn rate of 5% – 7% is considered acceptable. A churn less than 5% adds to the SaaS multiple whereas a churn higher than 7% reduces the multiple.
- LTV/CAC: The LTV must be balanced against the Cost of Acquiring the Customer. A successful SaaS company needs to earn, over the life of a customer, at least 3 times the cost of acquiring the customer:
LTV / CAC > 3
Payback period: A SaaS company needs a Payback < 12 months. Very successful companies can generate a pay back in 5 – 7 months.
These KPIs were developed early in the advent of SaaS as they are a better assessment of company performance than GAAP financial statements, particularly in the early stages when it is investing heavily in acquiring customers. While losing money it may be building a solid foundation or recurring revenue, which is better measured using these KPIs.
However, these KPIs are included in this discussion only for completeness. Their metrics are not used to adjust the SaaS valuation multiple in this discussion as their contributions are included by other factors:
- LTV includes revenue, gross margin and churn, which are included in the calculation of the BVM
- CAC is included in the company expenses which are also part of NRR rate which informs the baseline valuation multiple.
Therefore, we can eliminate double-counting by not including them again in the adjustment of the multiple.
Other Factors Informing SaaS Valuation
There is a myriad of other factors which can adjust the SaaS valuation, but, as with the SaaS KPIs, their effect is accommodated by factors already in the model. For example:
- Scalability – included in growth rate
- Market growth – rate of increase in the market in which the SaaS company competes; a rising tide raises all boats whereas in a drought everyone starves. This factor is included in Market Size.
- Network effects refers to the phenomenon that the demand for a service grows as the number of participants increases; think of social media. This factor is included in Market Size.
STEP 3: ADD UP THE FACTORS AFFECTING THE SAAS VALUATION MULTIPLE:
The infographic below summarizes the myriad of performance factors that inform the SaaS Valuation Multiple. In Step 1 you estimated the Base Valuation Multiple (BVM) from the SaaS Capital Table 1. In Step 2 you estimated an adjustment to each of the valuation Parameters.
In Step 3 add to the BVM all of the adjustment factors in Step 2 to derive the Adjusted SaaS Valuation Multiple.
As noted above, the Adjusted multiple should be within a range of + / – 30% of the BVM. If not, review your adjustments and consider whether you may have over-estimated one or more.
STEP 4: In this final step, multiply the adjusted multiple by the ARR to arrive at the final estimate of the SaaS valuation:
SaaS Valuation = ARR * Adjusted SaaS Valuation Multiple.
CONCLUSION
In this discussion about how to value a SaaS company, we started with a SaaS Capital’s formula to estimate a Baseline Valuation Multiple. Subsequently, we identified factors affecting the SaaS baseline valuation. Some are already included in the BVM calculation, whereas others can modify the BVM. The Adjusted Valuation Multiple can be inserted into SaaS Capital’s formula to estimate the final valuation.
The point to remember is that there are few exact definitive numbers. The adjustments require thought and experience. Be prepared to justify your estimated valuation using reasonable logic and comparables from other SaaS company transactions.
[i] Interestingly, Thomas Smale, CEO of FE International, has also studied the performance of SaaS companies extensively, and has been involved in over $50B worth of transactions. He opines that SaaS valuations increase more rapidly once the growth rate exceeds 40%. However, that is not apparent looking at the chart above: each increase of 10% in the ARR growth rate results in an increase in the baseline multiple of 0.8 at every point in the chart. This may because the SaaS Capital formula is a straight line best fit among many variables and has to be a straight line. It would be interesting to have FE International and SaaS Capital compare notes.
VIDEO PRESENTATION
We have included below a 16 minute video of the presentation David Rowat made to eFund on January 25, 2024. It quickly covers the main points of this article.